The Fastest Way to Build Internal Software
Every product begins with a question. Not just “what should we build?” but how should we build it?
If you’ve ever tried to launch a dashboard quickly, you’ve probably felt the tension: move fast, or build it right. It’s a familiar trade-off, one that’s cost countless teams time, clarity, and momentum.
Dashboards sound simple. Until they aren’t.
The moment you sit down to create one, you’re met with a hundred moving parts: authentication, database design, access control, data relationships, frontend components, real-time updates, and oh yes, users who expect it all to just work.
So what’s the right approach when the clock is ticking, and you’re tasked with delivering a dashboard MVP not in a month, not in a week, but in one day?
Some reach for tools that promise instant results, only to discover they’ve sacrificed long-term control for short-term speed. Others start from scratch, fully custom, painfully slow, dangerously complex.
But what if there was a third path?
A path that feels like cheating, but isn’t. A method that gives you the control of an architect, the speed of a prefab builder, and the confidence of knowing your work can scale, even before the first user logs in.
Not many talk about this. Fewer still can pull it off. Yet once you understand the blueprint, it becomes clear: the right tools, used the right way, can turn a dashboard dream into a deployable MVP by the end of the day.
What are those tools? When building an MVP, how do they fit together? And how do you keep structure and speed in harmony? The blueprint is in your hands. Let’s unfold the fastest way to build internal software with Retool and Supabase in a day.
Why Rapid Dashboards Matter and How Retool + Supabase Deliver Results in a Day?
Let’s take a quick real-world example.
A solo founder was building a SaaS product. He had all the right data on user behavior, system performance, and feedback logs, but no easy way to see or use it. Every dashboard request took time, tech skills, or outside help. It slowed him down just when he needed to move fast.
Then he tried something different: Supabase for real-time backend data, and Retool for building dashboards with a drag-and-drop interface.
Within a single day, he had a live dashboard showing everything from feature usage to customer activity. No complex code. No engineering team. Just clear, up-to-date, and valuable insights he could act on instantly.
That’s why rapid dashboards matter because when you can see what’s working and what’s not in real time, you make better decisions and stay ahead. Even small teams can build powerful, real-time dashboards in hours, not weeks. Now it’s time to know what retool is.
What is Retool?
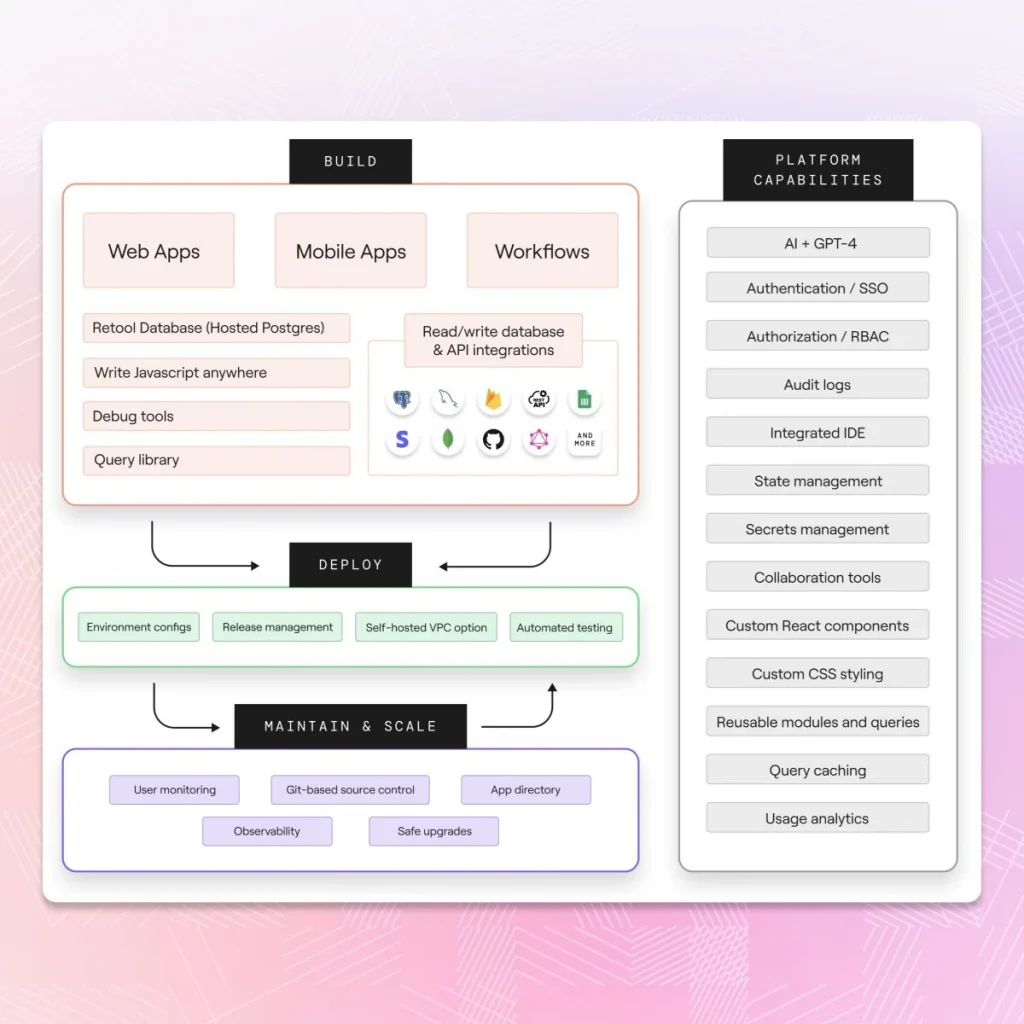
Retool is a low-code development platform that enables teams to build custom internal applications like dashboards, admin panels, and data explorers much faster than traditional frontend development. Instead of coding everything from scratch.
It offers a drag-and-drop UI builder, pre-built components like tables, charts, and forms, and seamless integrations with databases and APIs.
Specifically designed for creating data-centric applications that need to display, manage, or act on real-time information, all with minimal engineering effort. Let’s explore the features that make it easy to use.

Source: https://blog.boldtech.dev/
Key Features That Define Retool
- Drag-and-Drop Interface: Build user interfaces visually using a library of ready-made components, no complex frontend code required.
- Built-in Data Integration: Connect instantly to PostgreSQL, MongoDB, REST APIs, GraphQL, Firebase, Supabase, and many more data sources.
- JavaScript Flexibility: Customize logic, queries, and UI behavior using JavaScript directly inside the platform.
- Reusable Templates: Use existing templates for dashboards, CRMs, customer support tools, and inventory systems to get started even faster.
- Role-Based Access: Manage who can view or edit different tools, ideal for teams working across departments. Now that you’ve seen what Retool can do, here’s a quick look at how it works.
How Retool Works?
You start by connecting your data source. Then, instead of coding everything from scratch, you drag and drop ready-made blocks to design your dashboard or tool.
Behind the scenes, each block is linked to live data using simple SQL or JavaScript queries. These queries tell your tool what to show or what to do, like fetching customer info, updating a status, or filtering data by date.
Because Retool connects your data and your interface so closely, everything updates instantly. You can:
- Edit a record and see it change in real-time
- Filter customer data on the fly
- Trigger actions with a click
Source: https://www.superblocks.com/
How to Set Up Retool in 6 Easy Steps?
1. Open retool.com in your browser and use Google, GitHub, or email to set up your account. Once you’re in, you’ll land on the Retool workspace central hub for building internal tools, dashboards, and apps.
2. Navigate to the “Resources” tab in the sidebar. Click “Create New” and select the resource type based on your backend (e.g., PostgreSQL, REST API, Firebase, etc.). Input your connection details and test the setup before saving.
3. From the workspace, click “Create → App.” Give your app a name (like Analytics Dashboard or Task Manager) and launch the drag-and-drop editor to start building.
4. Add tables, charts, text fields, dropdowns, and buttons using Retool’s component panel. Resize and arrange components to reflect your interface layout and guide the user effectively.
5. Select any component (e.g., a table), create a new query, and bind it to your resource. You can write SQL, use JavaScript, or configure APIs to populate live data into your UI.
6. Use built-in logic, conditions, and event handlers to make your app interactive. Test everything in Preview Mode, then securely share or embed the finished app within your team or platform. Once your app is ready, it needs a solid backend. That’s where Supabase comes in.
What is Supabase?
Supabase is an open-source backend-as-a-service that provides developers with a ready-to-use backend stack built on top of PostgreSQL. It combines the flexibility and power of a relational database with essential backend features like user authentication, real-time subscriptions, file storage, and auto-generated APIs.
It offers the perfect mix of speed, structure, and scalability and gives you access to a fully managed PostgreSQL database. This means you can design relational data models, run complex SQL queries, and maintain consistency across your data, all using an industry-standard database engine.
So, what are the services that make Supabase ideal for dashboard development?
Supabase Core Services That Power Dashboard Development
A major strength of Supabase is its all-in-one toolkit for backend development. When you create a Supabase project, you get access to several integrated services immediately:
Database (PostgreSQL): A production-ready, hosted relational database with support for constraints, joins, indexes, and advanced SQL features.Authentication: A flexible auth system that supports email/password login, magic links, and third-party providers like Google or GitHub. It also includes role-based access and row-level security for fine-grained control.
Realtime Updates: Built-in support for real-time data streaming, allowing your dashboard to reflect changes instantly as they happen, ideal for monitoring user activity, system metrics, or inventory.
Storage: Object storage for managing files such as documents, images, and user uploads, complete with access rules.
Edge Functions: Serverless functions that allow you to run custom backend logic securely and on demand.
Setting Up Your Supabase Backend in 30 Minutes
1. Go to supabase.com and sign in with your GitHub account. Click “New Project,” give it a name, set a database password, and choose your server region. Supabase will instantly spin up a Postgres database with a project URL and API key.
2. Use Supabase Studio (the built-in dashboard) to navigate to the “Table Editor.” Click “New Table,” define column names, choose data types, and set a primary key (like id with auto-increment). This forms the structure of your backend.
3. Once tables are created, go to “Table View” and click “+ Insert Row” to add test records. This dummy data helps you visualize how content will appear once integrated into a dashboard or app.
Source: https://www.draxlr.com/
4. Supabase Studio makes it easy to view, filter, and update data. You can also create relationships using foreign keys to test joined queries and simulate more complex data models.
5. For multi-user dashboards or sensitive data, go to Authentication → Policies. Enable RLS and write policies to control access at the row level, ensuring each user only sees their own data.
6. Each table gets instant REST and real-time api access. You can query or update data directly using these endpoints. Need more? Supabase also offers GraphQL support and custom Edge Functions for advanced logic. Retool and Supabase are helping industries build fast, flexible apps. Here’s how.
Industries That Benefit from Retool & Supabase and How They Use it
We’ve seen it firsthand: many leading startups, eCommerce storefronts, or complex B2B platforms thrive when real-time insights are part of daily operations.
1. Financial Services & Fintech
Used for KPI dashboards to track revenue, customer value, churn, reconciliation, and fraud detection. Admin panel manages customers, transactions, credit cards, and support workflows. Organizations like Stripe and Bilt leverage Retool dashboards built on Postgres to streamline internal financial operations and customer support tools.
2. E‑Commerce & Retail
Retail and marketplace teams build inventory dashboards to monitor stock levels, supplier performance, order fulfillment, and revenue forecasting. Retool helps consolidate data across Shopify, Shopee, APIs, and internal systems for real-time insights.
3. Professional Services & Consulting
Companies rely on dashboards to track essential metrics such as utilization rates, project profitability, and client satisfaction. Admin panels help manage clients, projects, pipelines, resource assignments, billing, and support.
4. SaaS & IT Services
SaaS companies build internal tools for onboarding, customer support, subscription management, and data analytics. Admin UI for managing users, roles, teams, and content via integrated data sources like Postgres, Stripe, HubSpot, etc.
5. Logistics, Travel & Supply Chain
Used to build operational dashboards that monitor itineraries, shipments, supplier performance, alerts, and workflows. Travel agencies or logistics firms build custom dashboards connecting APIs, CRM data, and supplier info. Big names like Airbnb and Amazon build smart dashboards. Here’s what they do right and how you can follow their lead.
How Companies Like Airbnb, Uber, and Amazon Nail Their Dashboards and How You Can Too?
Dashboards are more than just charts and numbers. For companies like Airbnb, dashboards help operations teams monitor booking patterns, host behavior, and support load all in real-time. Uber relies on dynamic dashboards to track ride requests, driver availability, and geospatial data down to the city block. Amazon? Their dashboards help manage everything from inventory flow to delivery performance at a global scale.
What do all these giants have in common? Their dashboards are:
- Purpose-built, not overloaded
- Actionable, not just visual
- Aligned tightly with the backend data structure
Now, while you might not be managing millions of users yet, you can apply the same thinking. Whether you’re building a dashboard for a SaaS product, internal ops, or a startup MVP, here are the practices to follow, especially when using Retool for frontend speed and Supabase for backend simplicity.
1. Define a Clear Primary Purpose
Avoid dashboard sprawl. Focus on one key use case, such as monitoring support tickets, tracking revenue, or managing orders. A dashboard that tries to show everything ends up helping no one.
2. Choose Metrics that Drive Decisions
Don’t overload your dashboard with every number available. Pick high-impact KPIs like churn rate, open issues, or sales velocity that lead to clear actions. Leave out flashy stats that don’t add value to your specific goals.
3. Design for Interactions
Consider what users should do with your dashboard in advance. Should they resolve support tickets? Update status? Filter by department? These small actions define how useful your tool becomes in daily workflows.
4. Visualize Before You Build
Airbnb’s internal tools team prototypes UI before building, and so should you. Sketch out layouts using Figma, Miro, or even paper. This helps group related elements, avoids clutter, and ensures the interface flows logically.
5. Align UI Components with Supabase Data
For every button, table, or chart, ensure there’s a clear data source: a table, view, or SQL query from Supabase. If you need filters, join logic, or calculated fields, plan that early so Retool components connect cleanly.
6. Ship a Lean, Useful First Version
Amazon’s early dashboards weren’t perfect; they were just fast and functional. Start with a simple version that delivers core value. Then iterate based on feedback. Don’t wait for “perfect” before launching.
Use Retool to visualize and control, and Supabase to structure and secure. When you build with clarity up front, your tools won’t just look good, they’ll drive real business outcomes.
How to Connect Supabase to Retool for Live Dashboards?
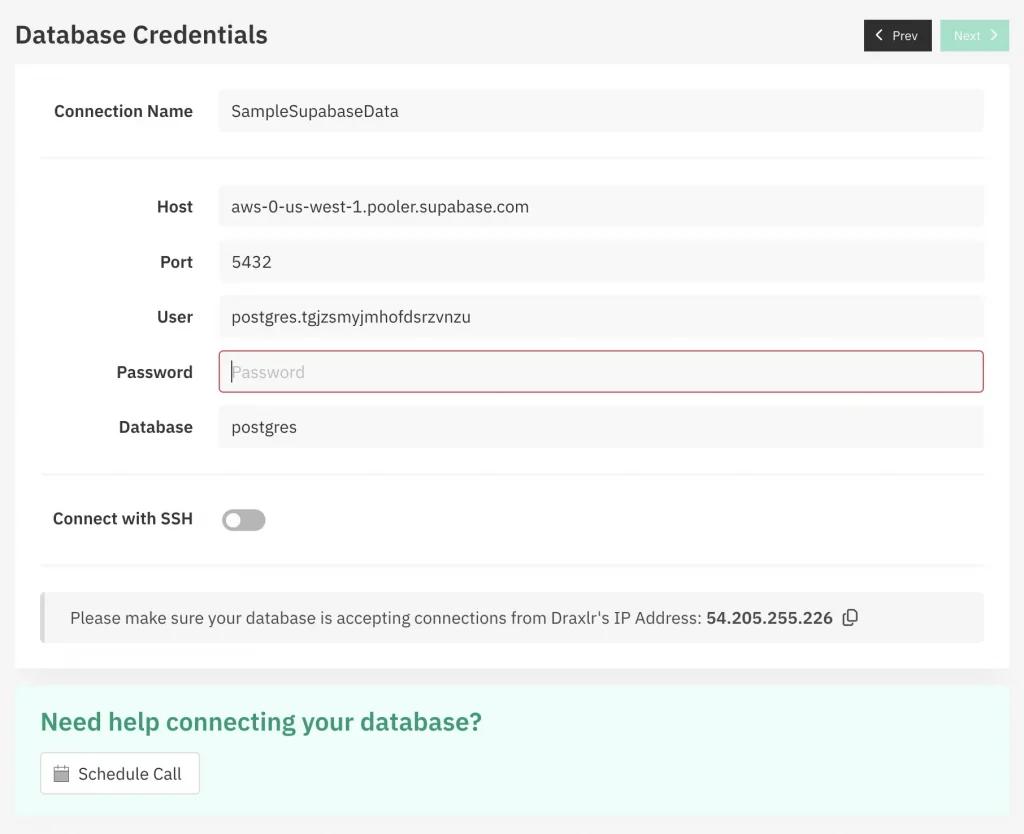
To connect Supabase to Retool, go to Retool → Resources → Add PostgreSQL, and enter your Supabase credentials (host, database name, user, password, and port). Test the connection once it’s green; you’re ready to run live queries.
Inside Retool, you can now create SQL queries or use the visual query builder to pull data from Supabase. Bind results to tables, charts, or dropdowns using drag-and-drop components. This keeps your dashboard synced with live data, no manual refreshes needed. You can mix visual editing with raw SQL database anytime for full control.
With live data and full control, adding the right interactive tools can make your dashboard much more useful.
Must-Have Interactive Elements to Supercharge Your Dashboard Experience
1. Add dropdowns, date pickers, and text inputs to let users narrow down results by time, category, status, or keyword.
2. Use JavaScript or parameterized SQL queries in Retool to make your dashboard respond instantly to user selections.
3. Let users interact with the data—create buttons to update records, insert new rows, delete entries, or trigger backend workflows.
4. Combine buttons with conditional logic or event handlers to automate tasks like sending alerts or modifying multiple records.
5. Add a “Mark as Complete” button that, when clicked, updates the corresponding task’s status directly in your Supabase table in real time.
6. Use confirmation modals, visual feedback (like toasts), and disable buttons when actions are not available to ensure a smooth, intuitive experience. Get to know the pros and cons.
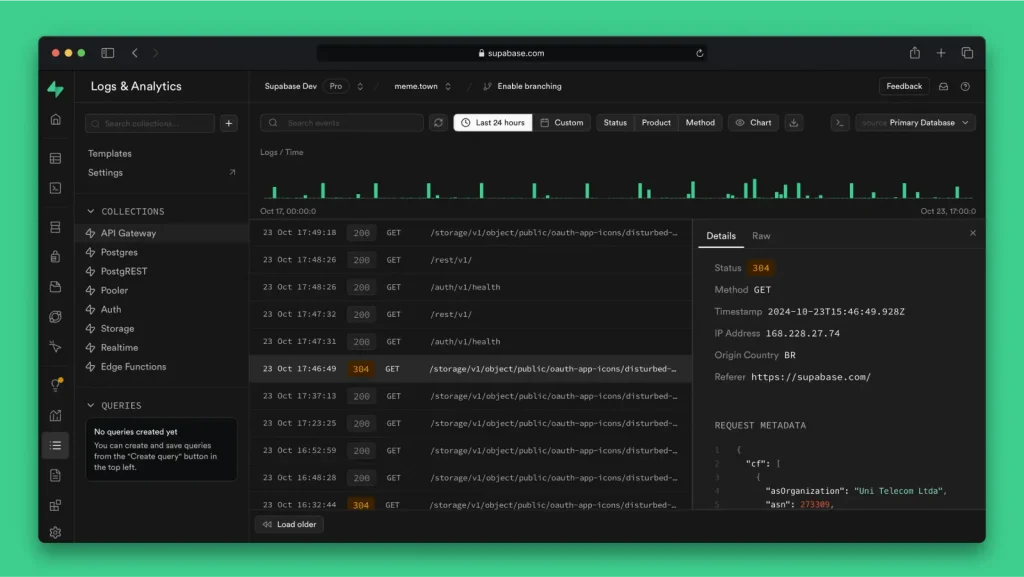
Making Your Dashboard Real-Time with Supabase Sync
Real-time dashboards transform how teams respond to data. Supabase, with its PostgreSQL-based real-time engine, enables your Retool dashboard to reflect live changes, whether it’s an order update, a new user signup, or an inventory adjustment. Subscriptions to table events (inserts, updates, deletes) ensure your data stays in sync without manual refreshes or reloads.
Why Go Real-Time? (The Pros)
- Instant Insights: Spot trends, errors, or opportunities as they happen, not hours later.
- Improved Collaboration: Everyone sees the same up-to-date data, reducing miscommunication.
- Better User Experience: Dynamic dashboards feel alive, support tickets update in real time, and analytics shift as events happen.
- Fewer Manual Refreshes: No need to poll data constantly or rely on outdated reports.
- More Responsive Workflows: Trigger actions or notifications the moment something changes
Source: https://supabase.com/
Also, consider the Trade-offs(The Cons)
- Resource Usage: Real-time connections (especially WebSockets) can increase server load if not optimized.
- Complexity for Edge Cases: High-frequency updates or custom sync logic may require additional tuning or throttling.
- Debugging Live Data: When data changes mid-action, it can introduce edge bugs if your Retool logic isn’t carefully scoped.
Supabase and Retool give you plenty of control, use auto-refresh for simpler dashboards, polling for selective queries, or WebSockets for full-scale real-time behavior. The key is to balance immediacy with performance, tailoring your real-time setup to what needs to be live. But all these depend on how it is deployed and shared. Keep reading.
How to Deploy and Share Your Dashboard Securely?
- Once your Retool dashboard is ready and connected to Supabase, the final step is to share it securely.
- You can publish dashboards for internal teams (within your organization) or external users like clients or partners.
- Internal apps are ideal for analytics, admin panels, and operations.
- For clients, you can create public-facing apps with restricted access to show only specific data, like KPIs or reports.
- Retool allows you to set who can view, edit, or manage dashboards using role-based access control.
- Supabase enhances this with Row-Level Security (RLS), so users only see the data they’re allowed to.
- This setup is especially useful for multi-tenant apps or dashboards with sensitive information.
- You can also embed dashboards into other tools or websites using secure iframe options.
- Features like signed URLs, domain whitelisting, and token-based authentication give you full control.
- Whether it’s an internal wiki or a customer portal, you can control exactly who gets access to what. Even with the tool’s strength, some challenges can come up. Here’s how you can handle them.
Common Challenges and Smart Workarounds
While Retool and Supabase make building dashboards remarkably fast, a few challenges can creep in if you’re not prepared.
Free-tier usage caps, for example, may limit performance under real-world loads, especially when handling background jobs or frequent API calls.
To avoid disruptions, consider scaling to paid plans early during MVP validation.
Real-time sync can also be tricky; missed updates are often due to misconfigured table policies, WebSocket issues, or missing triggers.
Always audit your Row-Level Security (RLS) and authentication flows when debugging.
Another important concern is data security. According to IBM’s 2024 Cost of a Data Breach Report, the average breach cost for small-to-mid-sized businesses was $3.6 million, with misconfigured APIs and poor access control among the top causes.
While Supabase supports robust RLS and Retool offers granular role-based permissions, overlooking these can expose sensitive data. Always enforce least-privilege access and audit permissions regularly, especially in client-facing dashboards.
Other common friction points include mobile responsiveness. Retool is desktop-first, so using collapsible layouts and responsive containers can help deliver a better mobile experience.
Lastly, large datasets can cripple performance if not managed smartly. Avoid full-table queries; instead, use LIMIT, OFFSET, indexed fields, and caching to improve load times.
By recognizing these issues upfront and designing around them, you not only improve performance but also ensure a safer dashboard experience as your product scales. Here are some tips you should know.
Pro Tips for Scaling Dashboards Built with Retool and Supabase
As your dashboard grows from a quick MVP to a business-critical tool, scaling it well becomes non-negotiable. Here are advanced yet often-overlooked strategies that set apart scrappy builds from polished, resilient systems.
#1 Use consistent naming and group dashboards by team or function. Clean structure means faster collaboration and fewer mistakes.
#2 Avoid loading entire datasets. Smart dashboards pull just the essentials, top rows, filtered results, keeping things snappy.
#3 Track every change. Test safely. Roll back easily. Git turns dashboard chaos into a controlled workflow.
#4 Build error states into your UI messages, retries, and fallbacks. Users stay informed even when something breaks.
#5 Test new features or layouts in safe environments. Protect real data set and real users from accidents.
#6 Turn date pickers, headers, and filters into modules. Maintain once, reuse everywhere, simple and scalable.
#7 Monoliths get messy. Break things up: one dashboard per function (e.g., sales, support, finance). Load faster, look cleaner.
#8 Don’t just authenticate, authorize. Use row-level security to control exactly what each user sees.
#9 Add logging or Supabase telemetry. Know which dashboards matter and which slow things down.
#10 Pre-process metrics in Supabase using triggers or cron jobs. Serve cached results instantly for better performance.
Ready to Turn Your Dashboard into a Scalable Business Asset?
Retool and Supabase make it easier than ever to launch internal tools and real-time dashboards, but building something fast, secure, and scalable still takes strategy, technical know-how, and careful implementation. That’s where Appkodes, a startup mobile app development company, can help.
With deep expertise in MVP software development, backend architecture, and real-time data sync, our team helps startups, SaaS companies, and enterprises build robust dashboards that don’t just look good but actually perform at scale.
Here’s what we bring to the table:
- Custom dashboard architecture
- Real-time data integration
- Version control and deployment strategies
- Advanced error handling, optimization, and user-friendly workflows
- End-to-end support from MVP to scale. Whether you’re building an analytics panel for internal teams, a client portal, or a real-time control center, Appkodes helps you go beyond quick prototypes and launch dashboards that scale confidently with your business.
Let’s make your AI MVP development smarter, faster, and more secure together. Contact Appkodes today and get a tailored consultation on how to bring your dashboard idea to life with maximum impact.

Arun Andiselvam
Founder of AppKodes. As a serial entrepreneur, I have successfully established five brands over the past 12 years. After creating a successful rank tracker for SEO agencies, I am currently dedicated to developing the world's first SEO Project Management software.