Track User Behaviour in Your MVP with Open-Source Tools and AI Insights
The harsh reality? Most startups don’t make it, and unclear user behavior is often to blame.
As founders, we invest time, effort, and emotion into building MVPs. But after launch, things get quiet. Users trickle in, and the numbers move… a little. But what are they doing? Are they using the features you thought they would? Are they stuck somewhere? Are they even finding value?
Far too often, we don’t know. We rely on assumptions. A few user comments here, some vanity metrics there, and we fill in the gaps with our guesses. But that’s a risky move, especially when nearly 90% of startups fail, and many because they build solutions people don’t use.
Here’s the truth: watching user behavior beats guessing every time.
It’s not just about counting clicks or visits. It’s about seeing how target users move through your product, where they pause, what they ignore, when they drop off, and which parts they use. These are the signals that tell you what’s working and what isn’t, long before a survey response ever arrives.
Now, you might be thinking this kind of tracking is out of reach unless you have a full analytics team or an expensive enterprise setup. But that’s no longer true. Yes! You can track user behaviour with open-source tools and AI Insights.
Open-source tools have changed the game for MVP builders. Today, lightweight, privacy-friendly tracking tools are available for free or at very low cost. Even better, many integrate seamlessly with modern product stacks. They let you track the metrics that matter without clutter, and they give you a clearer picture of how people are really interacting with your MVP.
Then comes the real magic: AI-powered insights. Artificial intelligence takes that behavioral user data and turns it into meaning. Instead of combing through dashboards and spreadsheets, you get clear signals where users struggle, what features drive user engagement, and what may need to go. It helps you reduce time spent guessing and increase confidence in your next move.
If you want your MVP to evolve into something users truly value, the first step is clear: stop assuming and start observing. This comprehensive guide on how to track user behaviour with open-source tools and AI Insights will help you track user behaviour in your MVP. Let’s start by understanding what user behavior tracking means.
What is User Behavior Tracking?
User behavior tracking means watching how real people use your product in everyday situations. It goes far beyond surveys or user interviews. It captures live, unfiltered actions like which buttons they click, how far they scroll, where they get stuck, or when they bounce off. These micro-signals form a clear picture of user intent, friction points, and moments of delight. Key data types include:
Clicks and Tap Events: Reveal what draws attention or triggers interest.
Scroll Depth and Heatmaps: Show how far users explore and where they lose interest.
Custom Events and Conversions: Tell you which actions lead to value (or drop-off).
Each of these behaviors provides clues about what’s working and what’s silently harming your MVP software development. That’s why tracking user behavior is so important. It reveals what’s helping your MVP grow and what might be holding it back.
Why Tracking User Behavior is Crucial for MVP Success?
Launching an MVP isn’t just about building fast; it’s about learning fast. You start with a bold idea, a few wireframes, and the hope that your solution will click with real users. But once your product is out in the world, what happens next?
Do people get it?
Are they using the features you bet on?
Or are they silently bouncing, never to return?
That’s why it’s crucial to track user behaviour in your MVP to truly understand what’s working and what’s not.
1. You’re Testing a Hypothesis
Every MVP is based on a series of assumptions. That your problem exists. That your solution helps. That your users behave a certain way. Tracking user behavior is how you check those assumptions against reality.
Do they have the potential issues? When your key feature gets ignored, it’s a clear signal something isn’t right.
Does your solution resonate? Engagement rates is your answer key. If users keep coming back to a feature, you’re on to something.
Are you reaching the right audience? Sometimes it’s not who you thought. Behavior data reveals who’s finding value and how they use what you’ve built.
The beauty of tracking isn’t in confirming your beliefs; it’s in showing you where you’re wrong early enough to course-correct.
2. Move Beyond Opinions. Watch What People Do
Everyone has opinions: your team, your users, your investors. But real progress comes from observation, not assumption.
Where are users getting stuck? Heatmaps, click tracking, and session recordings highlight friction that no survey will capture.
Are people taking the path you designed? User flow analysis shows whether your intended experience matches how people navigate.
Which features matter most? Usage frequency and retention around specific tools help you prioritize what to improve or remove.
This kind of granular insight turns iteration from guesswork into precision. You’re not just building; you’re sculpting, based on real-world evidence.
3. User Engagement is the Real Signal
Anyone can rack up sign-ups with a good ad. But true product value is revealed by what users do after they sign up.
Daily or weekly active users (DAU/WAU) show whether people stick around.
Retention curves reveal if users return days, weeks, or months later.
Feature adoption rates help pinpoint the magical “Aha!” moments that keep users coming back.
This is how you know your MVP isn’t just interesting, it’s useful, sticky, and potentially scalable.
4. Save Time, Money, and Sanity by Catching Issues Early
Let’s face it: building the wrong thing is expensive financially and emotionally. But behavior data acts like an early warning system.
Catch broken flows before users churn.
Focus your energy on the features that matter, and cut the ones that don’t.
Make faster, smarter pivots if the data shows your assumptions were off.
This isn’t about being perfect. It’s about being nimble, using insight to reduce development costs, and increasing speed where it matters.
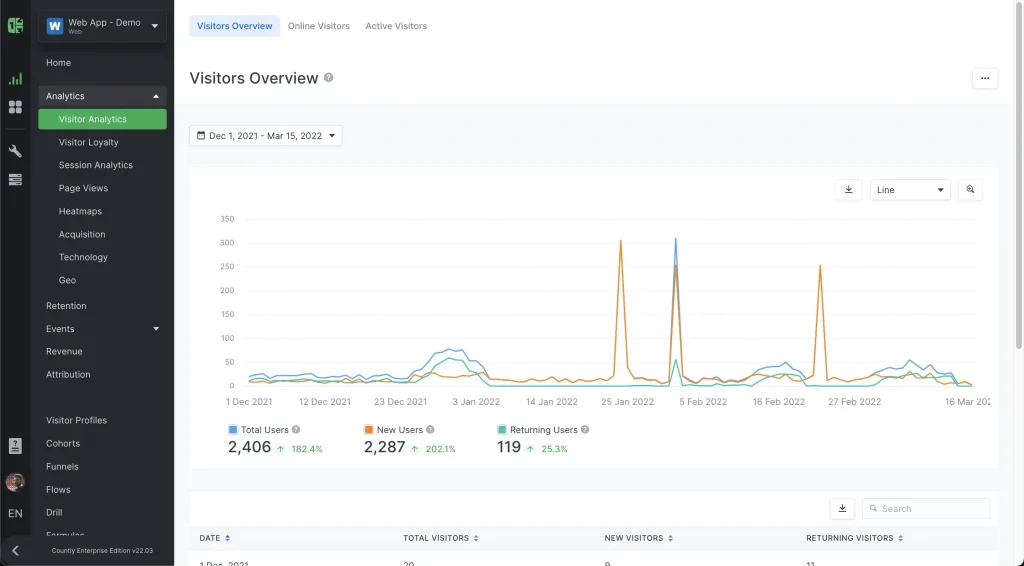
Source: https://support.countly.com/
5. Build a Culture That Trusts Data Over Ego
Even at the MVP stage, tracking user behavior lays the foundation for a truly product-led company.
Your team works with clarity, not gut feelings.
Your roadmap is shaped by need, not noise.
You can improve faster when your feedback loop is short.
When the whole team can track user behaviour in your MVP and understand the reasons behind it, it becomes easier to adjust, collaborate, and move forward together. Here’s where theory meets practice. Let’s look at real-world MVPs.
Real-World MVP Learnings
Some of the best pivots in tech didn’t come from luck; they came from listening to user behavior. Take Instagram, for example. It started as a broader check-in app (Burbn), but the founders noticed that users were mostly using one feature: photo sharing.
That behavioral insight led to a sharp pivot and massive success. Or consider Dropbox, which used a simple explainer video to track user sign-ups and engagement before building out the full product. This lightweight tracking validated their core value proposition offering and helped prioritize the right build path.
Behavioral data doesn’t just help you iterate; it helps you survive the MVP phase with clarity, confidence, and customer alignment.
Best Open-Source Tools to Track Behavior with Use Cases
When you’re building an MVP, the right tools can mean the difference between flying blind and making smart, data-backed decisions. Fortunately, open-source tools now offer powerful behavior-tracking ai capabilities without locking you into expensive platforms. Here are six standout tools, each with a unique strength and ideal use case.
1. PostHog
PostHog is a powerhouse for early-stage teams that want an end-to-end behavioral analytics stack. It offers event tracking, session replays, and built-in A/B testing all without needing third-party integrations. Its heatmaps, user path visualizations, and feature flagging make it perfect for iterating fast while learning how users navigate your product.
2. Plausible Analytics
If your MVP is landing-page heavy or content-driven, Plausible delivers clean, privacy-focused analytics without bloated dashboards. It’s straightforward to use, clear to follow, and privacy-friendly by design. It tracks visits, bounce rates, and referral sources just enough to validate your early traction and user interaction interest.
3. Umami
For developers who want full control without unnecessary complexity, Umami is a go-to. It offers real-time tracking and minimal dashboards that give you the essentials: page views, devices, referrers, while keeping your data fully self-hosted. Great for MVPs that value speed, privacy, and a no-frills experience.
4. Matomo
Matomo is ideal for founders with high data sensitivity or enterprise clients. It supports conversion funnels, campaign tracking, and on-premise hosting for full compliance with GDPR and HIPAA. If your MVP deals with regulated industries or must meet strict privacy requirements, Matomo brings confidence and control.
5. Countly
Mobile-first MVPs need more than just web analytics. Countly steps in with event tracking, crash analytics, and in-app feedback collection. It’s excellent for monitoring how users interact with mobile apps and collecting feedback while they’re still in the flow, which helps prioritize features from the ground up.
6. GoAccess
For developer teams who love working in the terminal, GoAccess is a fast, command-line-based tool for real-time web log analysis. It parses server logs to show traffic data, visitor locations, and request trends without needing a JavaScript snippet. Lightweight, efficient, and great for server-centric MVPs.
Tools show you what users are doing, but adding AI helps you understand why and gives you much deeper insights.
Layering AI Tools to Extract Deeper Behavioral Insights
Raw analytics can tell you what users did, but it rarely reveals why they did it. That’s where layering AI into your behavior tracking workflow becomes a game-changer. Generative AI helps uncover hidden patterns, surface actionable user insights, and predict user intent before issues even appear. When paired with open-source tools, AI transforms your MVP analytics from passive dashboards into active, decision-driving intelligence.
1. User Behavior Clustering (AI Pattern Detection)
Instead of viewing users as just numbers, AI can help you group them by actual interaction behaviors. Using tools like Scikit-learn or PyCaret, you can cluster users based on session paths, engagement depth, or feature usage. This lets you build dynamic audience segments not just by age or geography, but by how they interact, unlocking more personalized and focused iterations.
2. AI-Powered Funnel Analysis
Funnels often break at hidden points, and AI systems can find those faster than manual review. By applying anomaly detection or using LLMs (Large Language Models), you can automatically highlight unexpected drop-offs in key flows such as signups, purchases, or feature adoption. LLMs can even suggest UX improvements by summarizing behavioral trends or surfacing overlooked pain points.
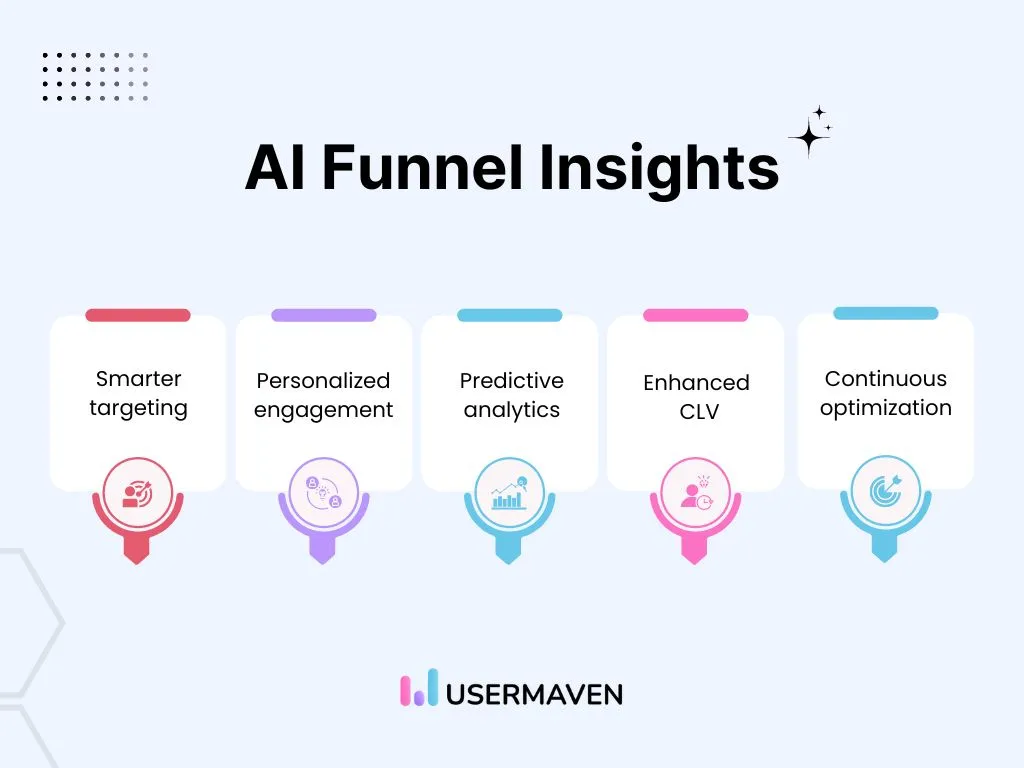
Source: https://usermaven.com/
3. NLP-Based Sentiment Insights from Feedback
User feedback often holds valuable signals buried in messy language. With spaCy, HuggingFace Transformers, or similar NLP models, you can analyze support tickets, reviews, or feedback forms to detect sentiment, recurring frustrations, or praised features. These emotional cues help guide both product and messaging decisions, directly informed by your users’ voices.
4. Predictive Attention Zones via Heatmap Modeling
What if you could predict where users will look before they ever click? AI-driven computer vision models can simulate visual attention heatmaps based on your design layout even before launch. These predictive maps help you pre-validate UI decisions and then compare them to real heatmap data collected via tools like PostHog or FullStory, closing the loop between prediction and reality.
To bring these insights to life, you need the right tools like machine learning models, and some are in place. Let’s walk through a simple, step-by-step process.
Setting Up Your Tracking Stack: Step-by-Step Guide
Building a smart behavior tracking system for your MVP doesn’t have to be overwhelming. With a clear setup flow, you can move from guesswork to insight quickly, even with open-source tools. Here’s how to structure your tracking stack for speed, clarity, and scalability:
Step 1: Define Events and Success Metrics
Start by asking: What specific user actions signal success? Whether it’s finishing onboarding, exploring a core tool, leaving feedback, or buying a product, each action matters.. Define clear events that map to your MVP goals. This gives your tracking setup focus and avoids noise. Whether you’re tracking button_clicked, profile_created, or checkout_initiated, knowing what matters most is step one.
Step 2: Install and Configure the Tools
Next, choose and deploy your preferred tracking tool: PostHog, Umami, or Countly, for example. Hosting them can be done via Docker, a VPS, Google Cloud, or your favorite cloud platform (like AWS or Render). Then, embed the necessary client-side or server-side scripts into your app. At this point, you’re collecting behavioral data directly from real users in real time.
Step 3: Connect to Data Pipelines (Optional but Scalable)
As your MVP grows, raw event data can become messy or hard to work with. That’s where data pipelines help. Using tools like Airbyte (for syncing data from various sources) and Apache Superset or dbt (for modeling and visualizing), you can clean, organize, and route data more effectively. This step isn’t required on day one, but it sets you up for scale and better insight down the line.
Step 4: Layer AI Models for Predictive Analytics and Insights
Once your data is flowing, it’s time to extract meaning. Run clustering models to find user groups, classification models to detect drop-off causes, or summarization models using LLMs. You can use LangChain, spaCy, or even basic Python scripts to pipe data through large language models that summarize, collect feedback, flag UX issues, or surface emerging trends, all without needing a full data science team.
Now that you’ve collected and analyzed the data, the next step is making it easy to understand. A clear, actionable dashboard helps your whole team spot trends, track KPIs, and quickly respond to what users are doing, turning insights into real product improvements.
How to Build an MVP Dashboard That Highlights What Matters?
A well-structured dashboard isn’t just about looking good; it’s your real-time pulse check on whether your app MVP is working. For founders, the goal is clarity and actionability. The goal is to catch problems early, understand their root cause, and act quickly to improve the experience.
At minimum, monitor these key metrics weekly: activation rates (how many users complete the onboarding or first-use action), average session length (time spent in-app), key feature usage (how often users engage with core features), and rage clicks (repeated clicking in frustration, a clear UX red flag).
To make sense of this data, organize your dashboard in three high-value sections.
Section 1 should be a live funnel view, showing conversion paths across your core flows (e.g., sign-up → onboarding → feature use).
Section 2 can feature session replays or attention zones helping you visualize exactly where users get stuck or lose focus.
Section 3 is your smart layer: AI-generated summaries that analyze user and patterns, flag anomalies, or suggest improvements, giving you instant clarity on trends without digging through raw logs.
For visualization, open-source tools like Metabase, Apache Superset, Streamlit, or Grafana make building these dashboards efficient and flexible. Whether you’re displaying SQL-modeled metrics or integrating AI-generated insights, these platforms offer customizable interfaces that grow with your MVP.
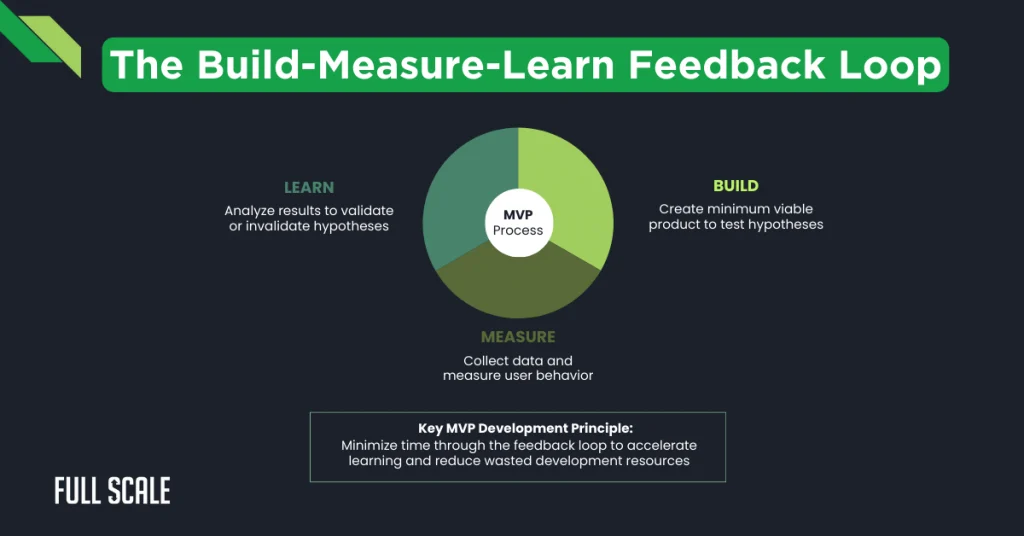
Source: https://fullscale.io/
The result? You get signal, not noise, and that means faster, smarter product and design decisions.
Tracking is just the beginning. The real value comes when you track user behaviour and user engagement in your MVP, then use that data to drive informed decisions, test new ideas, and personalize user experiences. Let’s explore how to make your setup for your MVP’s sustainable growth.
Turn User Behavior Insights into Real-Time MVP Iterative Improvements
Tracking user behavior is a great start, but the real magic happens when you turn that data into action. To truly understand your users and build a product they love, you need to blend quantitative data (what users do) with contextual feedback (why they did it).
Tools like Countly or OpenReplay let you combine session replays with in-app feedback widgets, so you’re not just watching behavior, you’re hearing from users at the exact moment friction happens.
One powerful technique is to trigger micro-surveys at behavioral breakpoints. For example, if a user fails to complete a form or exits mid-flow, prompt them with a simple “Was this helpful?” or “What stopped you?” message. This real-time context transforms generic customer feedback into sharp, actionable insights.
To stay proactive, set up AI-powered anomaly alerts that notify you when something unusual happens, like a spike in drop-offs or a sudden change in user behavior. With LLMs or rules-based logic, you can automatically flag these events and send alerts directly to Slack, email, or Notion dashboards. It’s like having a product analyst on-call 24/7, helping you act fast and stay aligned with your users’ needs.
Even with the best tools, it’s easy to fall into common traps. Let’s look at some key mistakes to avoid when tracking user behavior in your MVP so your data stays clean, useful, and truly actionable.
Quick Fix Checklist for Smarter Minimum Viable Product Behavior Tracking
→ List 3–5 key events tied directly to your MVP’s success (e.g., sign-up completed, feature used, upgrade clicked).
→ Remove irrelevant or low-impact events from your analytics setup to keep dashboards clean and actionable.
→ Add cookie consent banners, anonymize IPs, and verify your stack supports GDPR, CCPA, or HIPAA if needed.
→ Pair behavioral data with session replays, tooltips, or gather user feedback prompts to understand why users behave a certain way.
→ Integration of AI or simple logic rules to detect drop-off spikes or user anomalies, and push alerts to Slack or email in real time.
→ Schedule a 30-minute founder dashboard review every week to catch patterns early and plan smart iterations.
As the power of AI evolve, the future of behavior analytics will be more adaptive. From auto-tagging user sessions to real-time feature feedback loops powered by LLMs, behavior tracking will soon shift from reactive analysis to proactive product intelligence. Here’s how.
What’s Next: Future of Behavior Analytics in MVPs
The future of MVP behavior tracking is not just smarter, it’s intelligent, driven by predictive analytics. When you track user behaviour in your MVP, you unlock the power of AI-augmented product discovery.
Founders can now test and refine ideas before writing a single line of code. By combining LLMs with behavioral models, startups can simulate how users might interact with new features, reducing risk and sharpening product intuition early.
Even more promising is how synthetic user testing is starting to take off. Instead of waiting for real users to uncover issues, pre-trained AI models can now mimic real human behavior across your product flows, stress-testing UX, finding edge cases, and optimizing paths before launch. It’s like having an army of digital landscape testers running 24/7.
At the heart of all this is a powerful shift: open-source + AI is becoming the new MVP superpower. These tools offer founders a rare edge: low cost, high transparency, full control, and intelligence baked in. No more black-box analytics or bloated dashboards. The next wave of MVPs will be built not just faster, but smarter, with AI and open tech leading the charge.
Build Smarter MVPs with Appkodes
Behavior-driven product development is the fastest route to building an MVP that users truly want. When you track user behaviour in your MVP using open-source tools and AI insights, you can make smarter decisions from day one.
Appkodes, a startup mobile app development company, helps lean startups move beyond assumptions by using data-driven insights, rapid prototyping, MVP validation, and enterprise AI techniques.
We begin by aligning our MVP development process with user expectations, ensuring every feature and function AI outputs reflect how users interact with your MVP. By integrating open-source analytics, tools, and recommendation engines, we uncover areas for improvement early. Our team is an expert in leveraging AI layers, building high-quality data dashboards.
Also, our development team ensures your MVP compliance with GDPR, HIPAA, or CCPA.
Want to go deeper? We leverage platforms like Hugging Face to layer powerful AI models that predict churn, summarize feedback, or cluster users based on behavior, giving you clear insight into how users interact and how to develop user flows that stick.
Inspired by the Eric Ries lean startup model, our approach favors rapid iteration with tight feedback loops, so you can test, learn, and evolve without overbuilding.
Whether you’re developing a proof of concept, building AI MVP development, or selecting the right tech stack, our experience with user funnel analysis and user behavior mapping, and MVP validation helps your product evolve from experiment to a scalable solution that users love.
With Appkodes, you harness the power of model development to build smarter, and stronger. Ready to turn your vision? Let’s connect and help users to interact with your product the way you intended.

Arun Andiselvam
Founder of AppKodes. As a serial entrepreneur, I have successfully established five brands over the past 12 years. After creating a successful rank tracker for SEO agencies, I am currently dedicated to developing the world's first SEO Project Management software.